

Waka Kotahi | NZ Transport Agency
Client
Work
Brief
When the NZ Transport Agency was in the process of planning their community engagement campaign for a large roading project in Taranaki – they approached Wonderlab to help with preparing the consultation materials.


The objectives
Engaging stakeholders in a community consultation process on the Awakino Gorge to Mt Messenger Programme
Community consultation
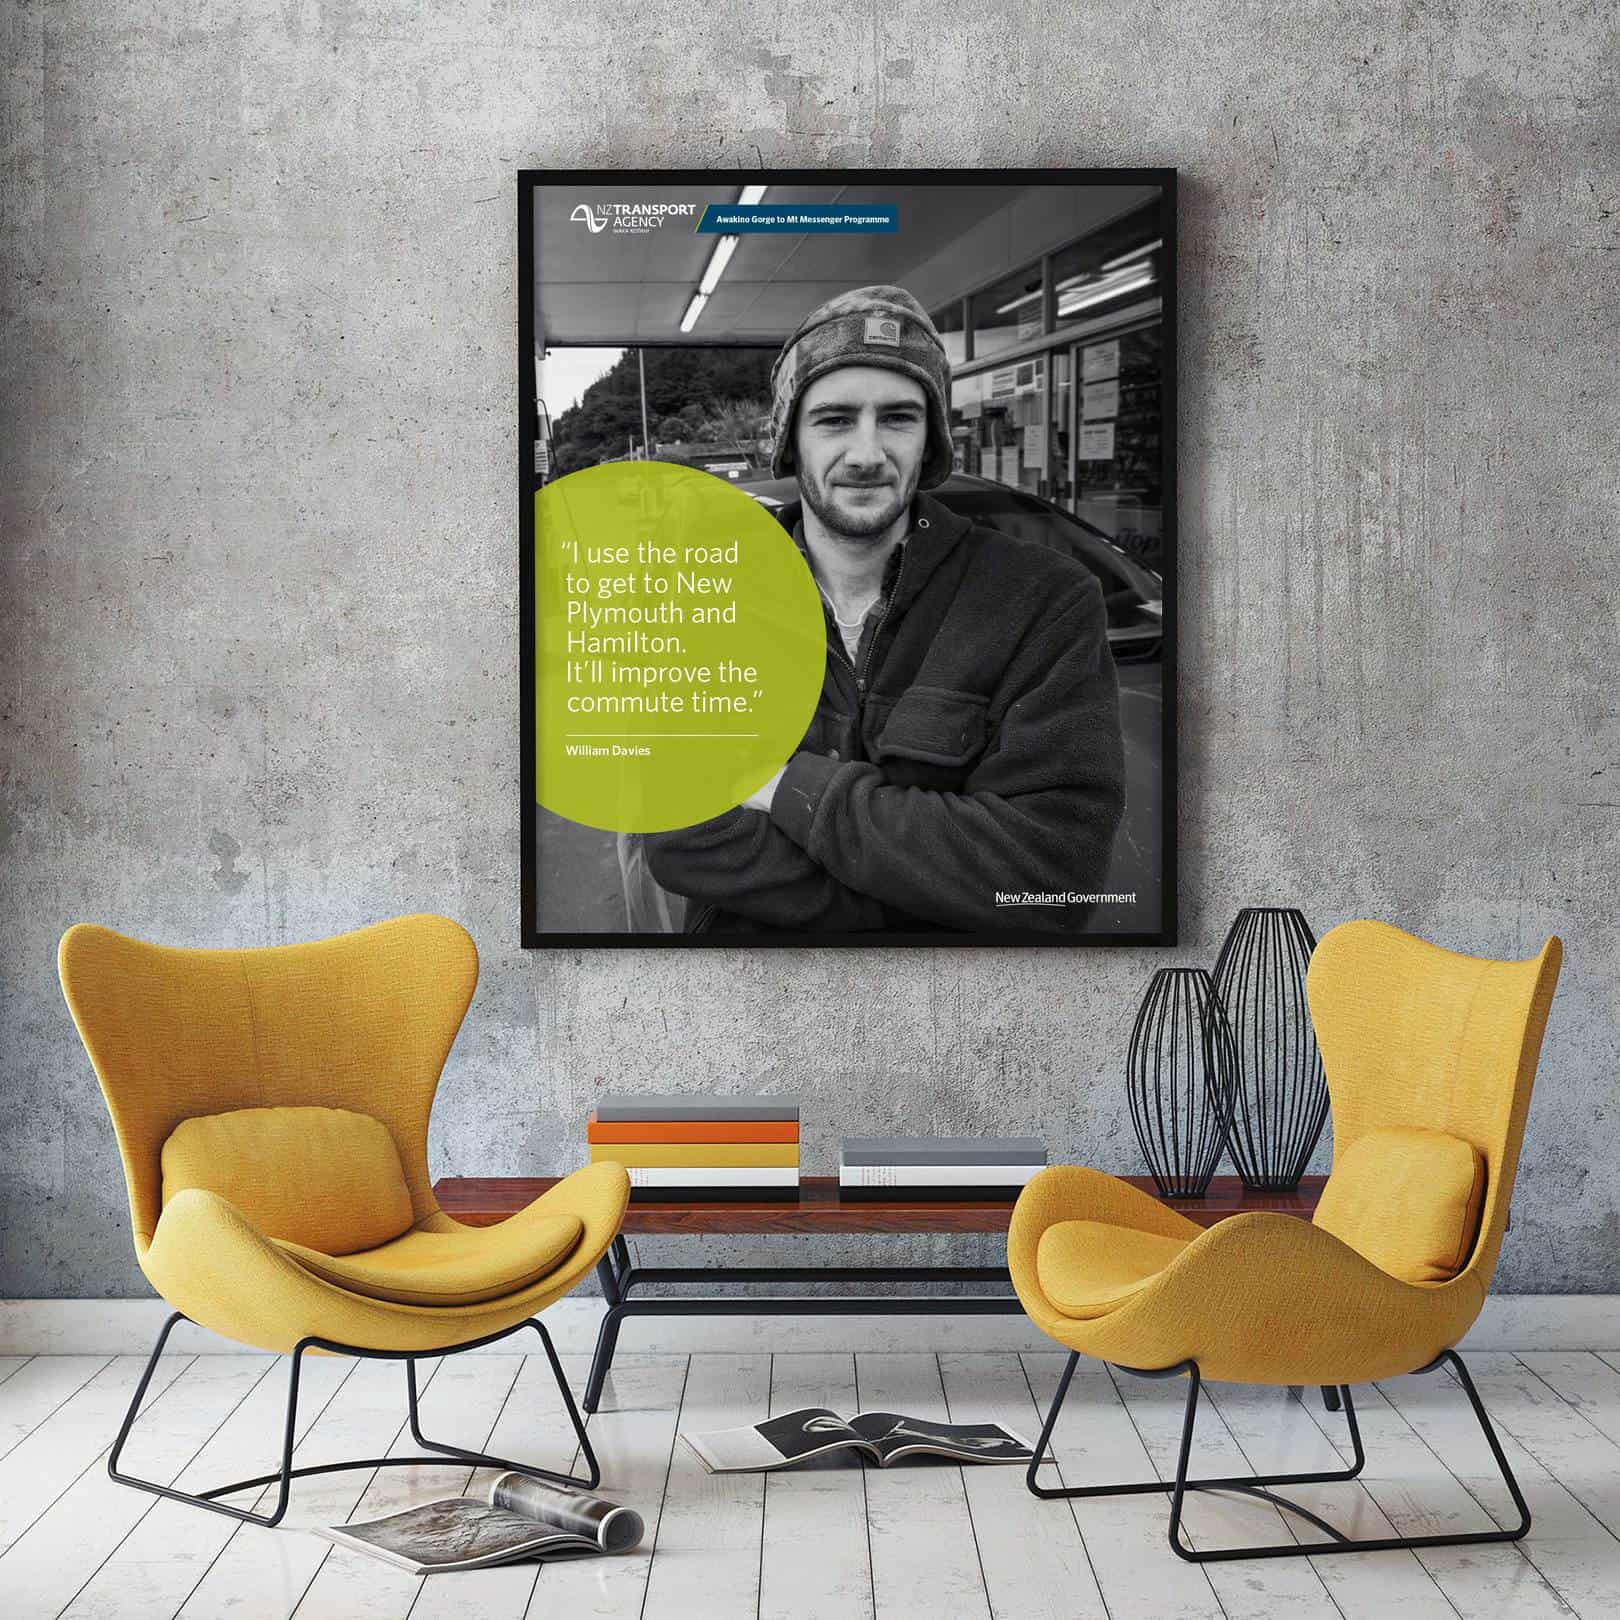
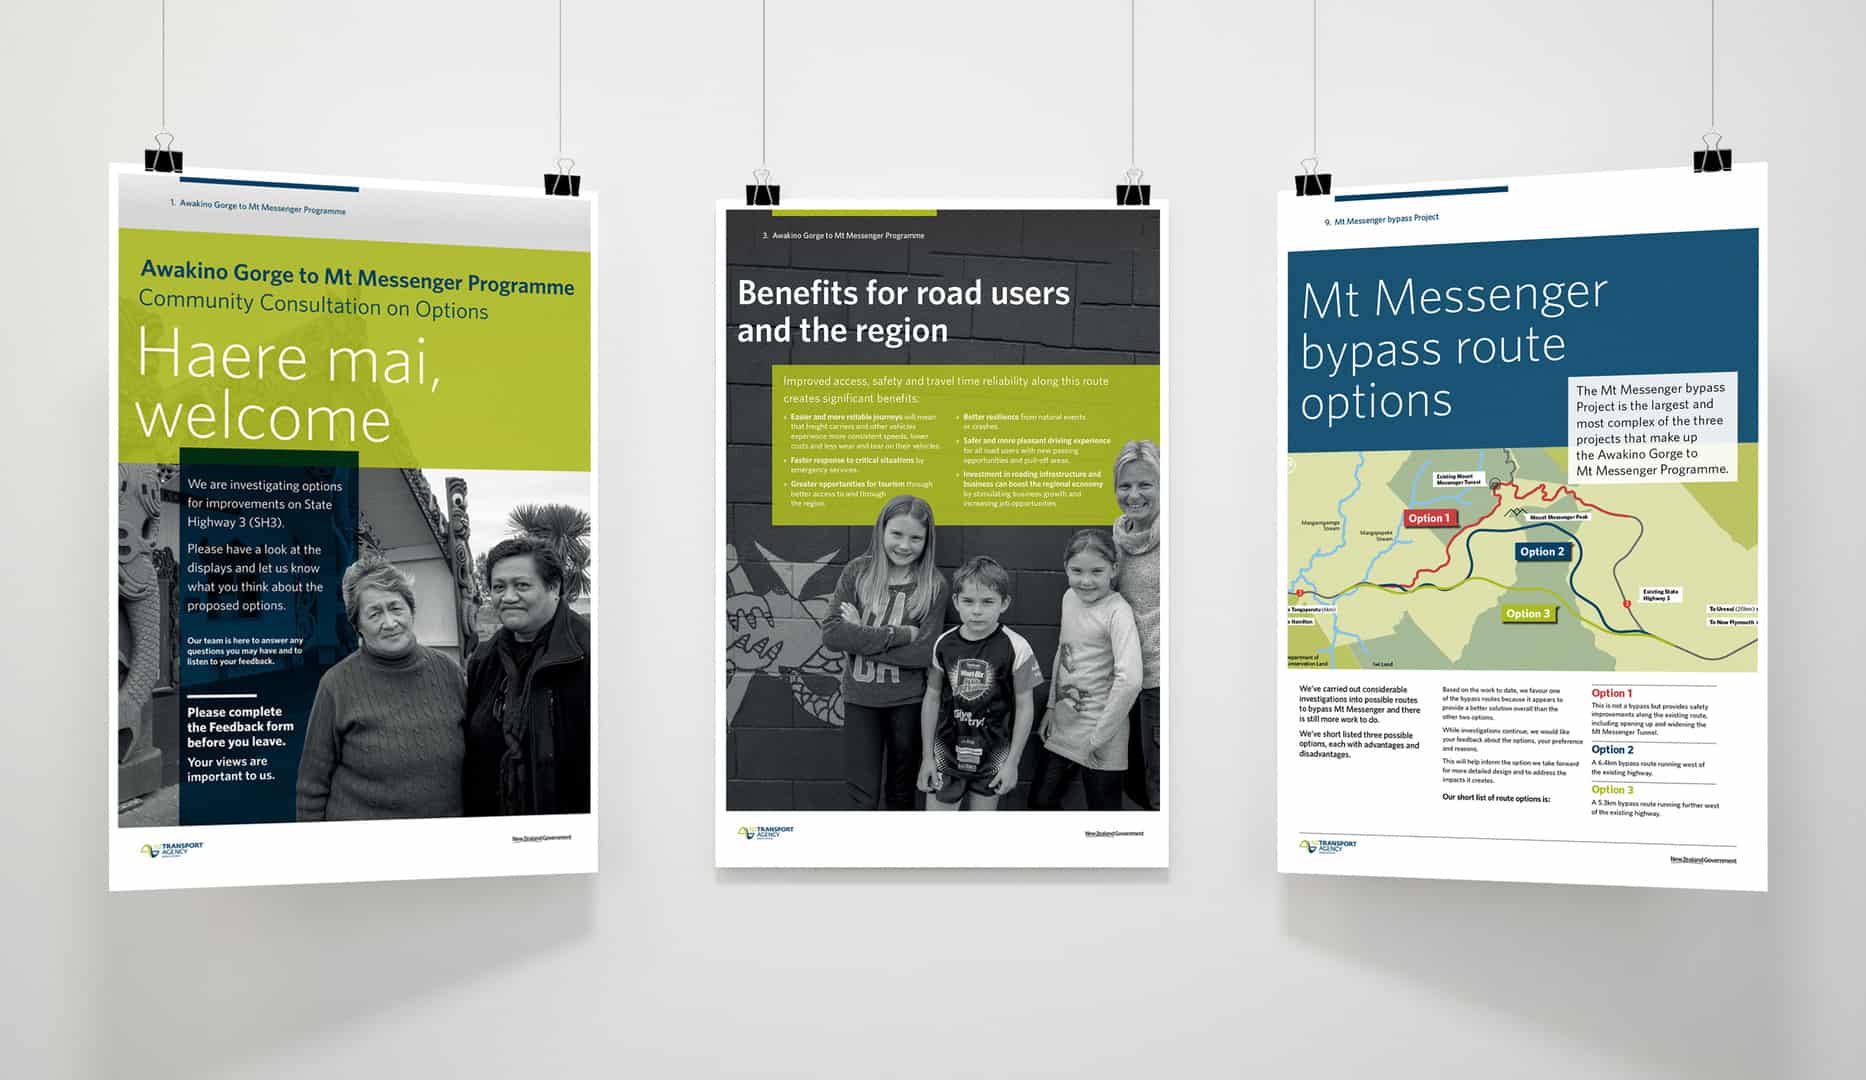
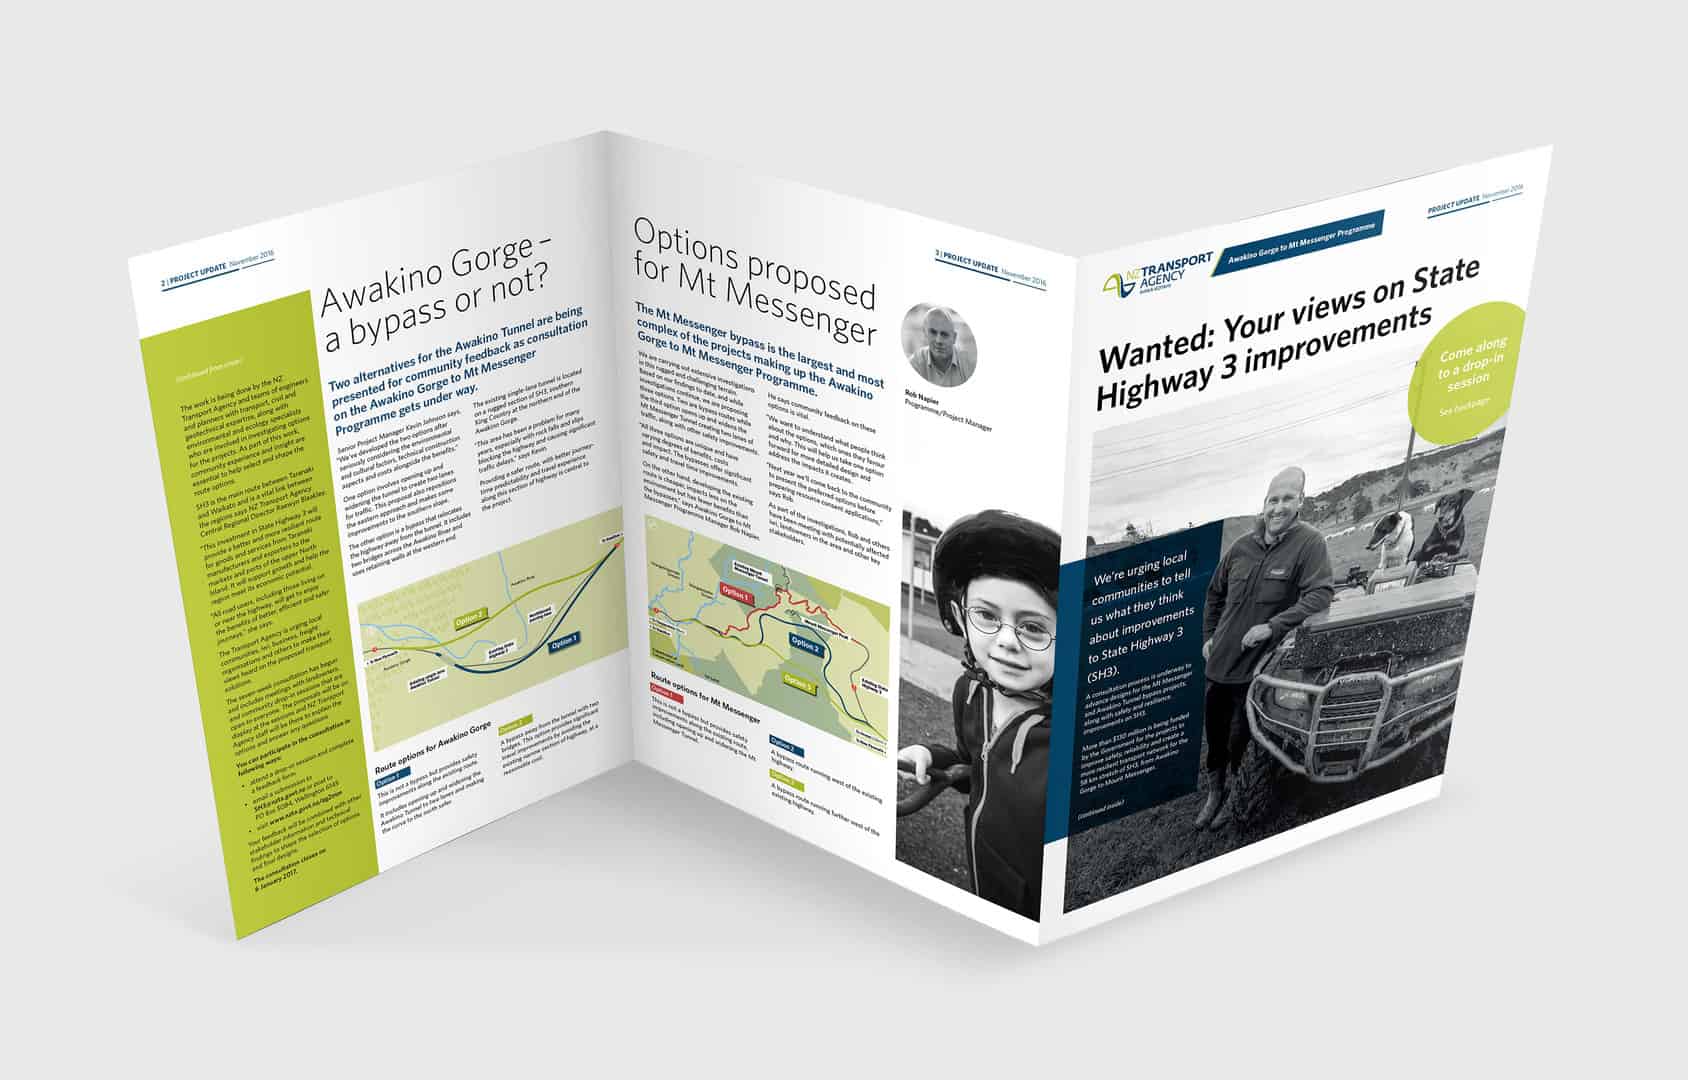
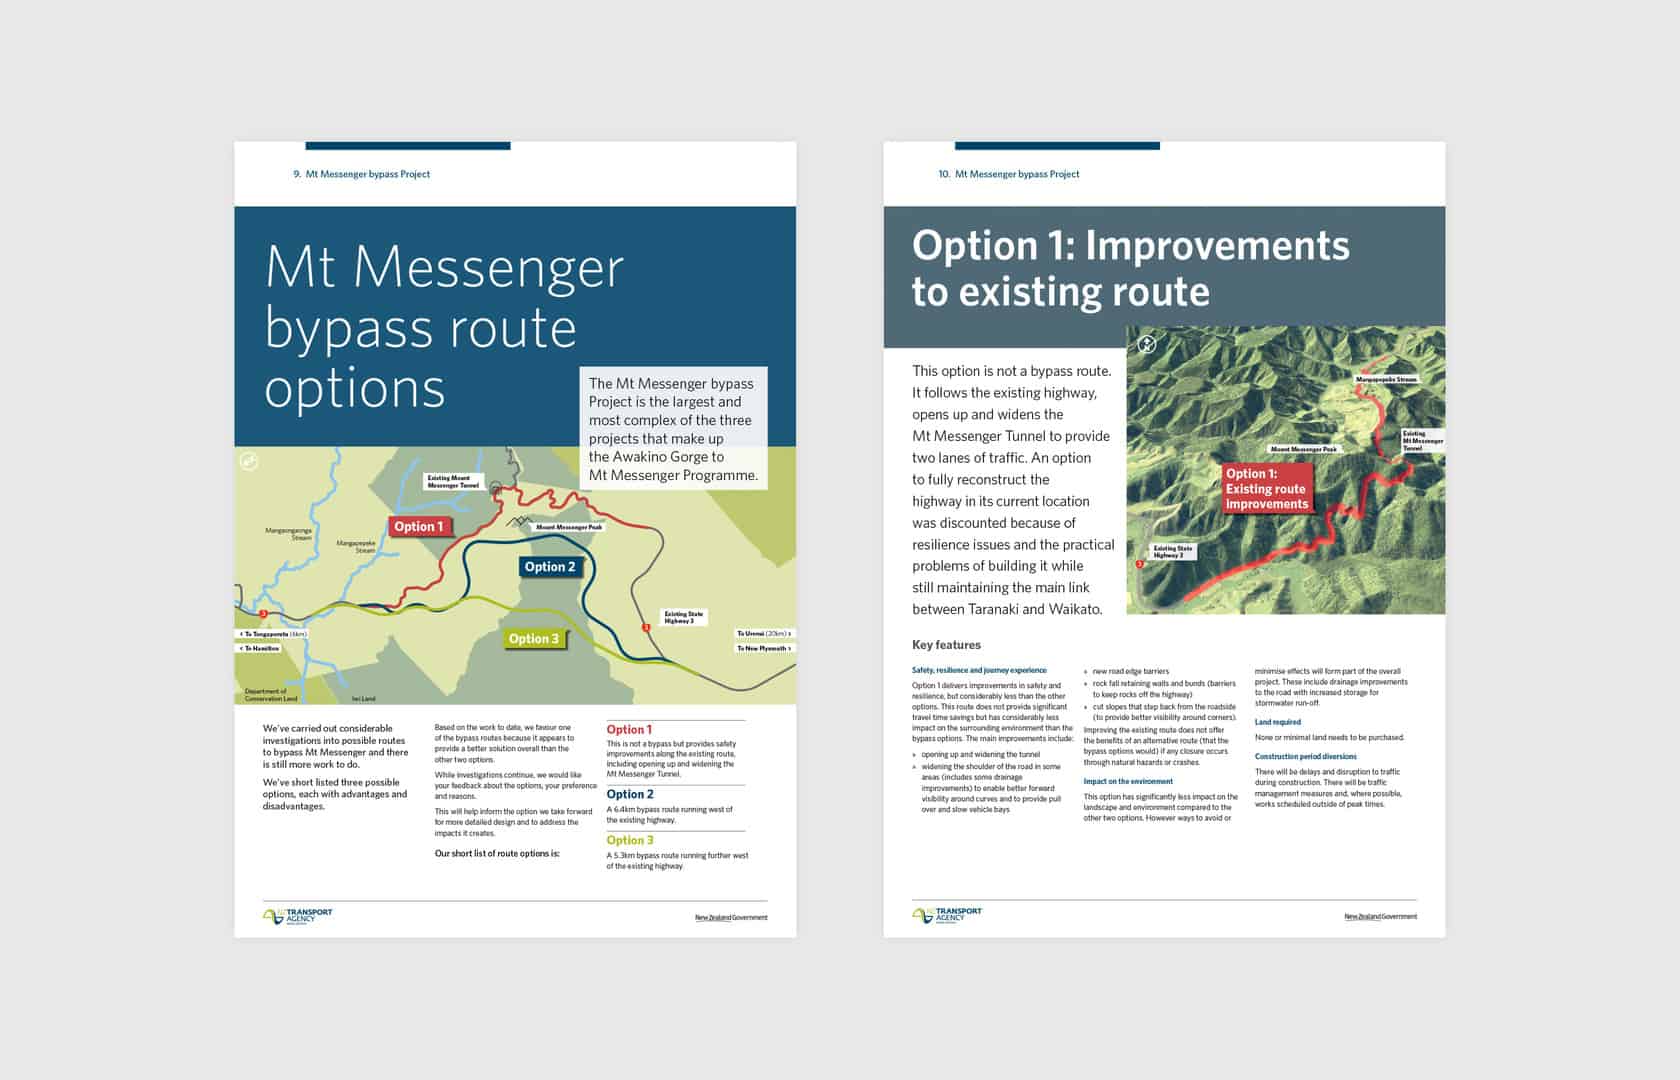
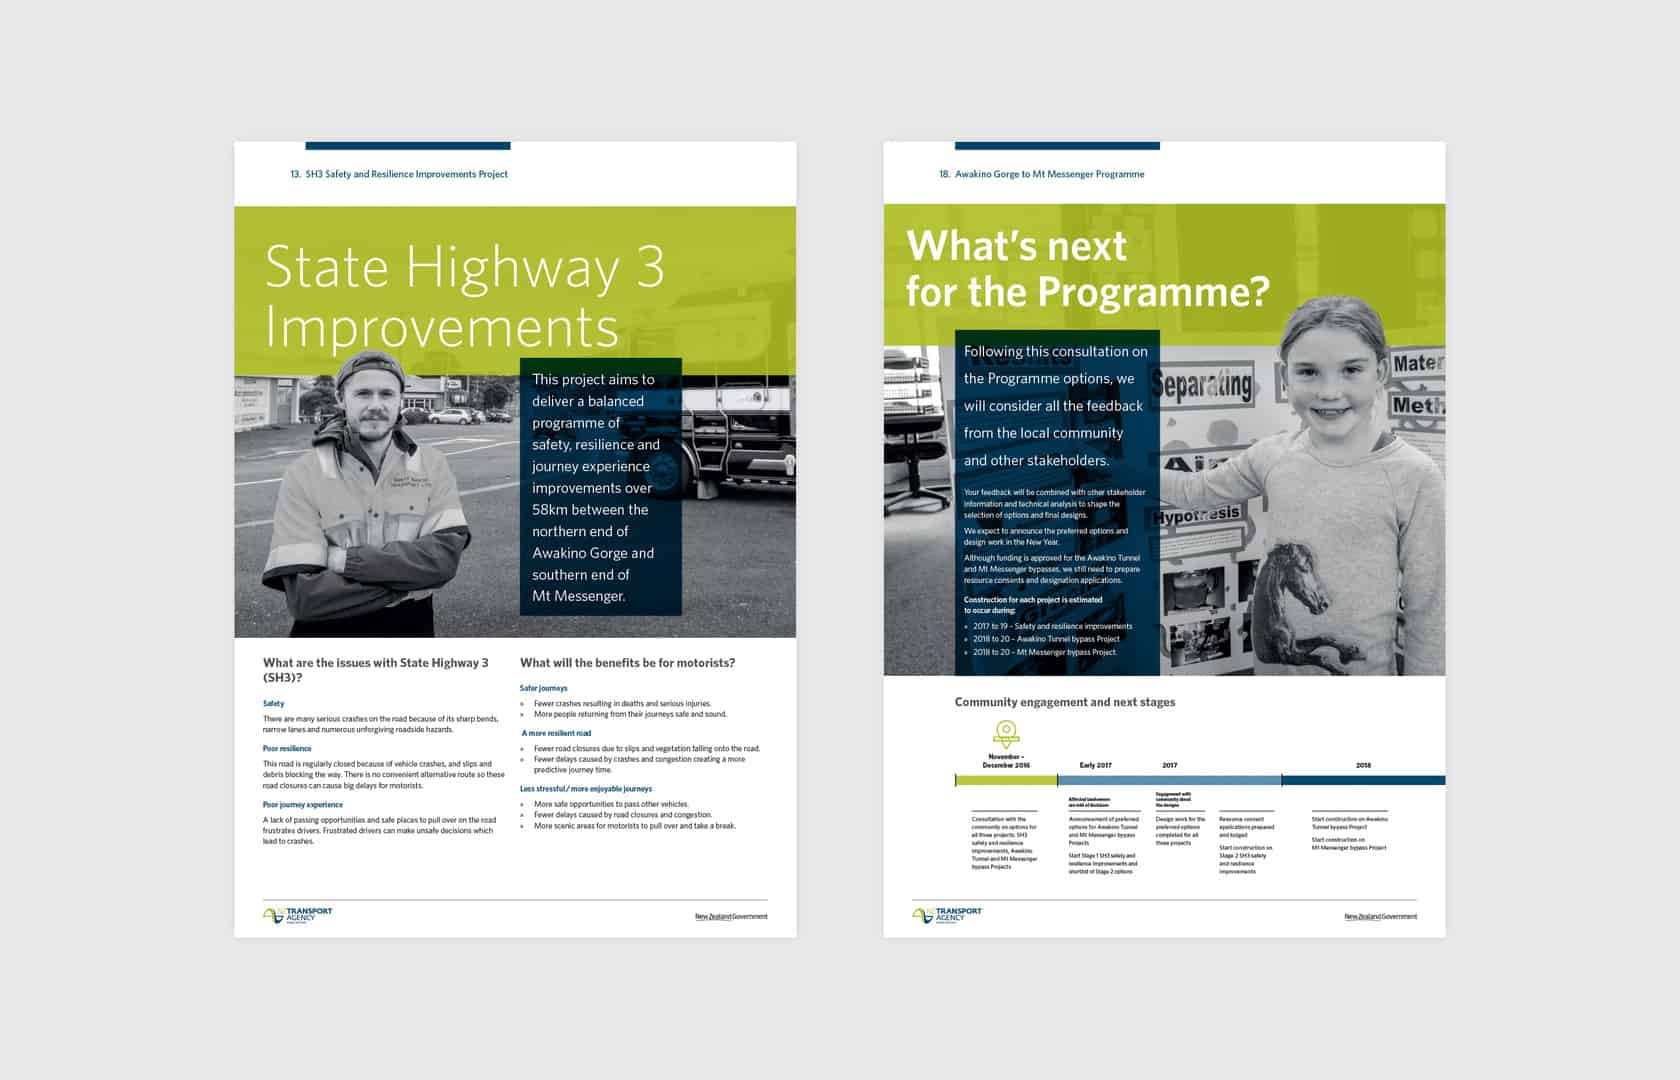
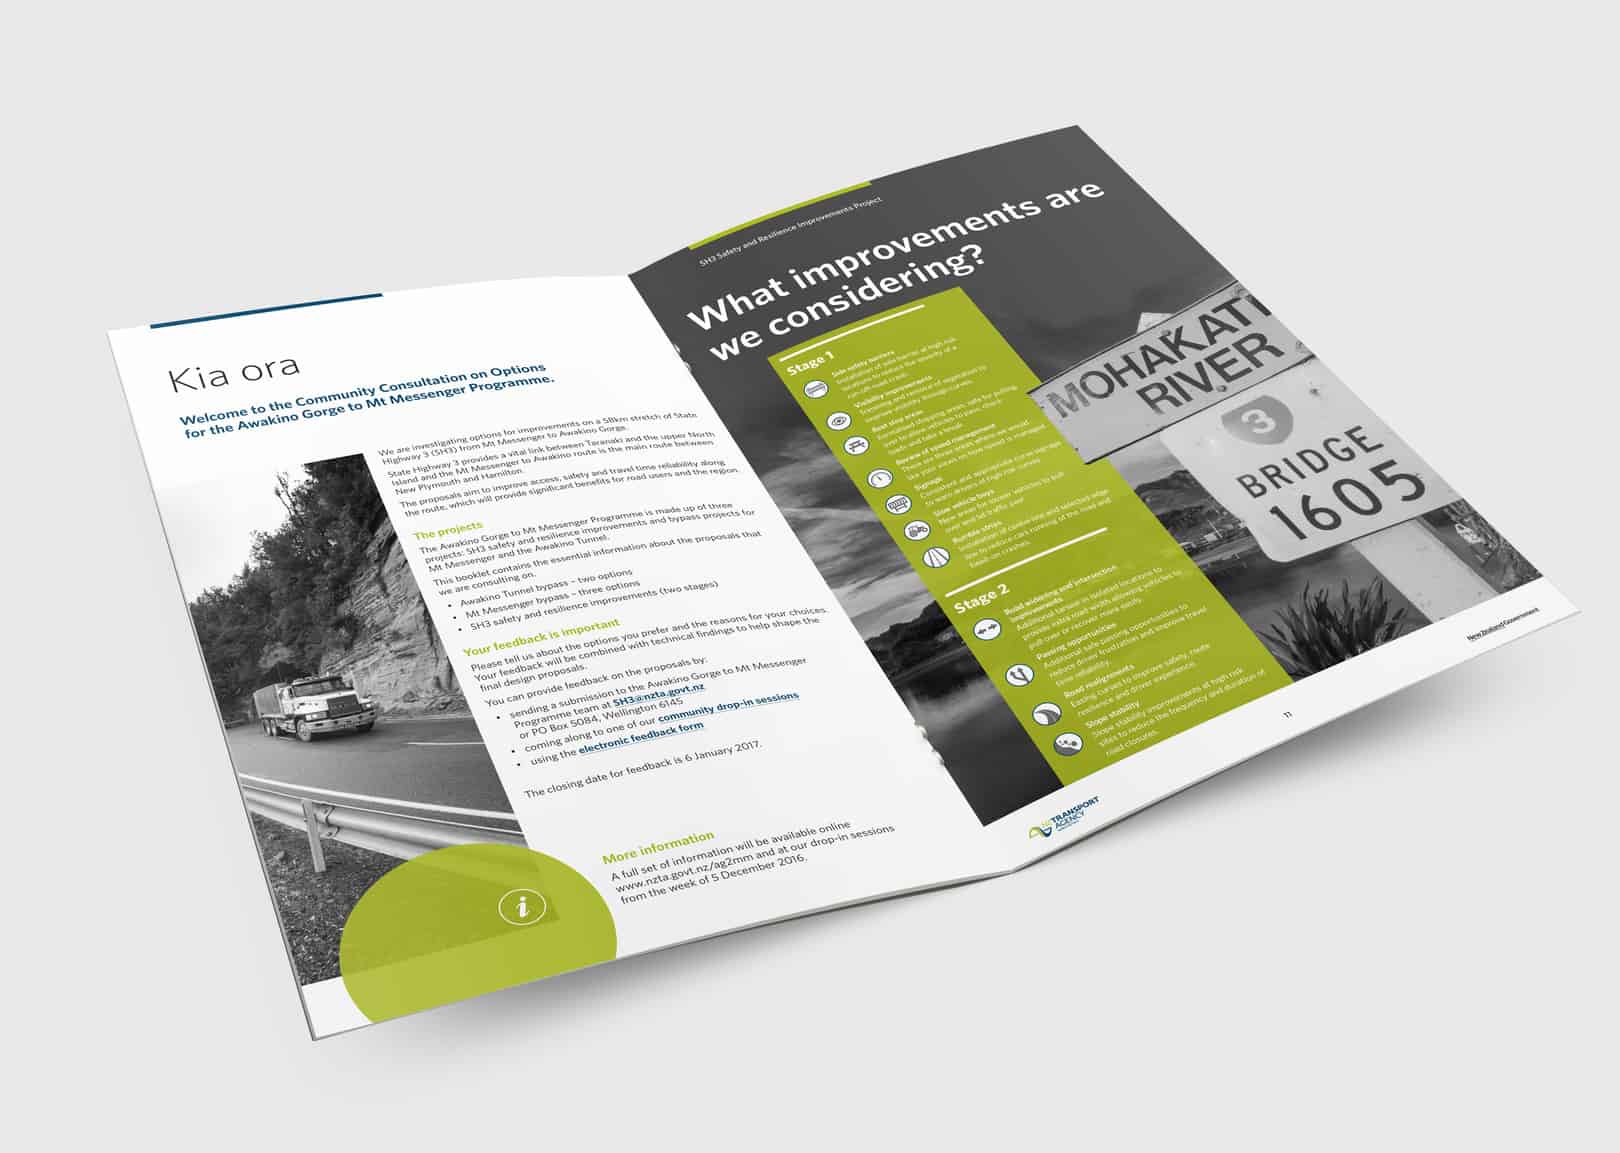
A government roading project of this magnitude – with a 58km stretch of State highway to be improved, new tunnels dug and bridges built – needed very careful consultation with the community and stakeholders involved.
Create collateral
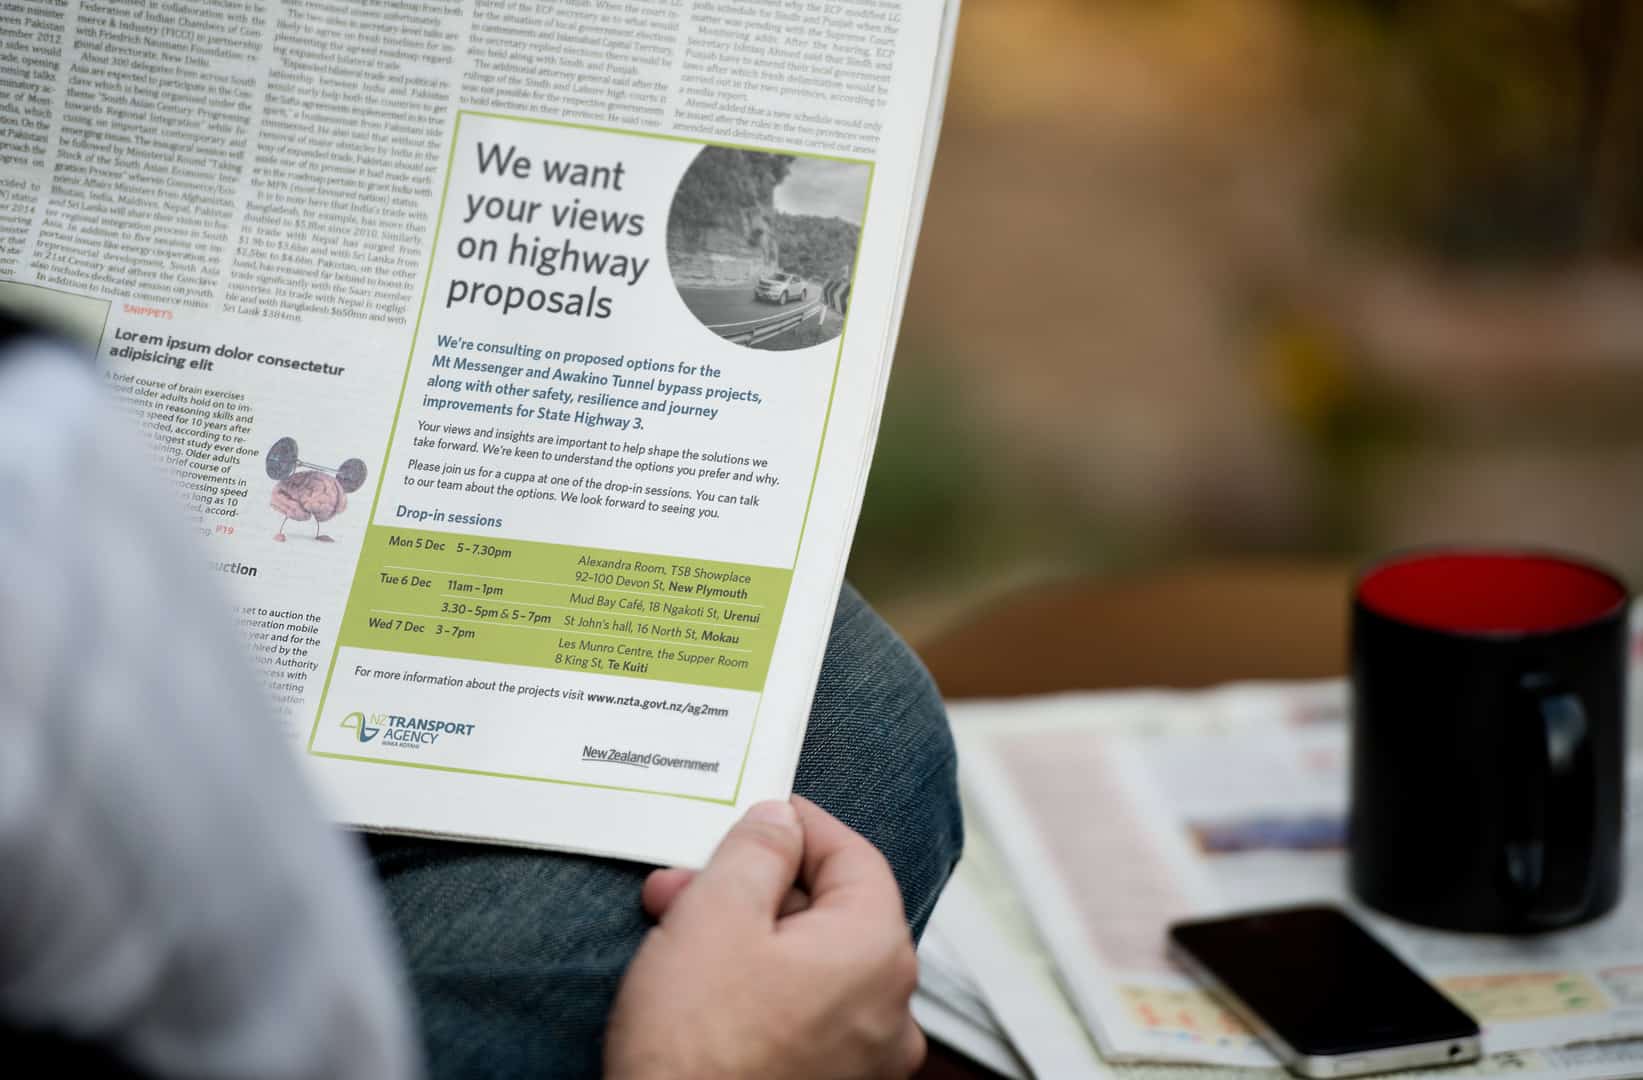
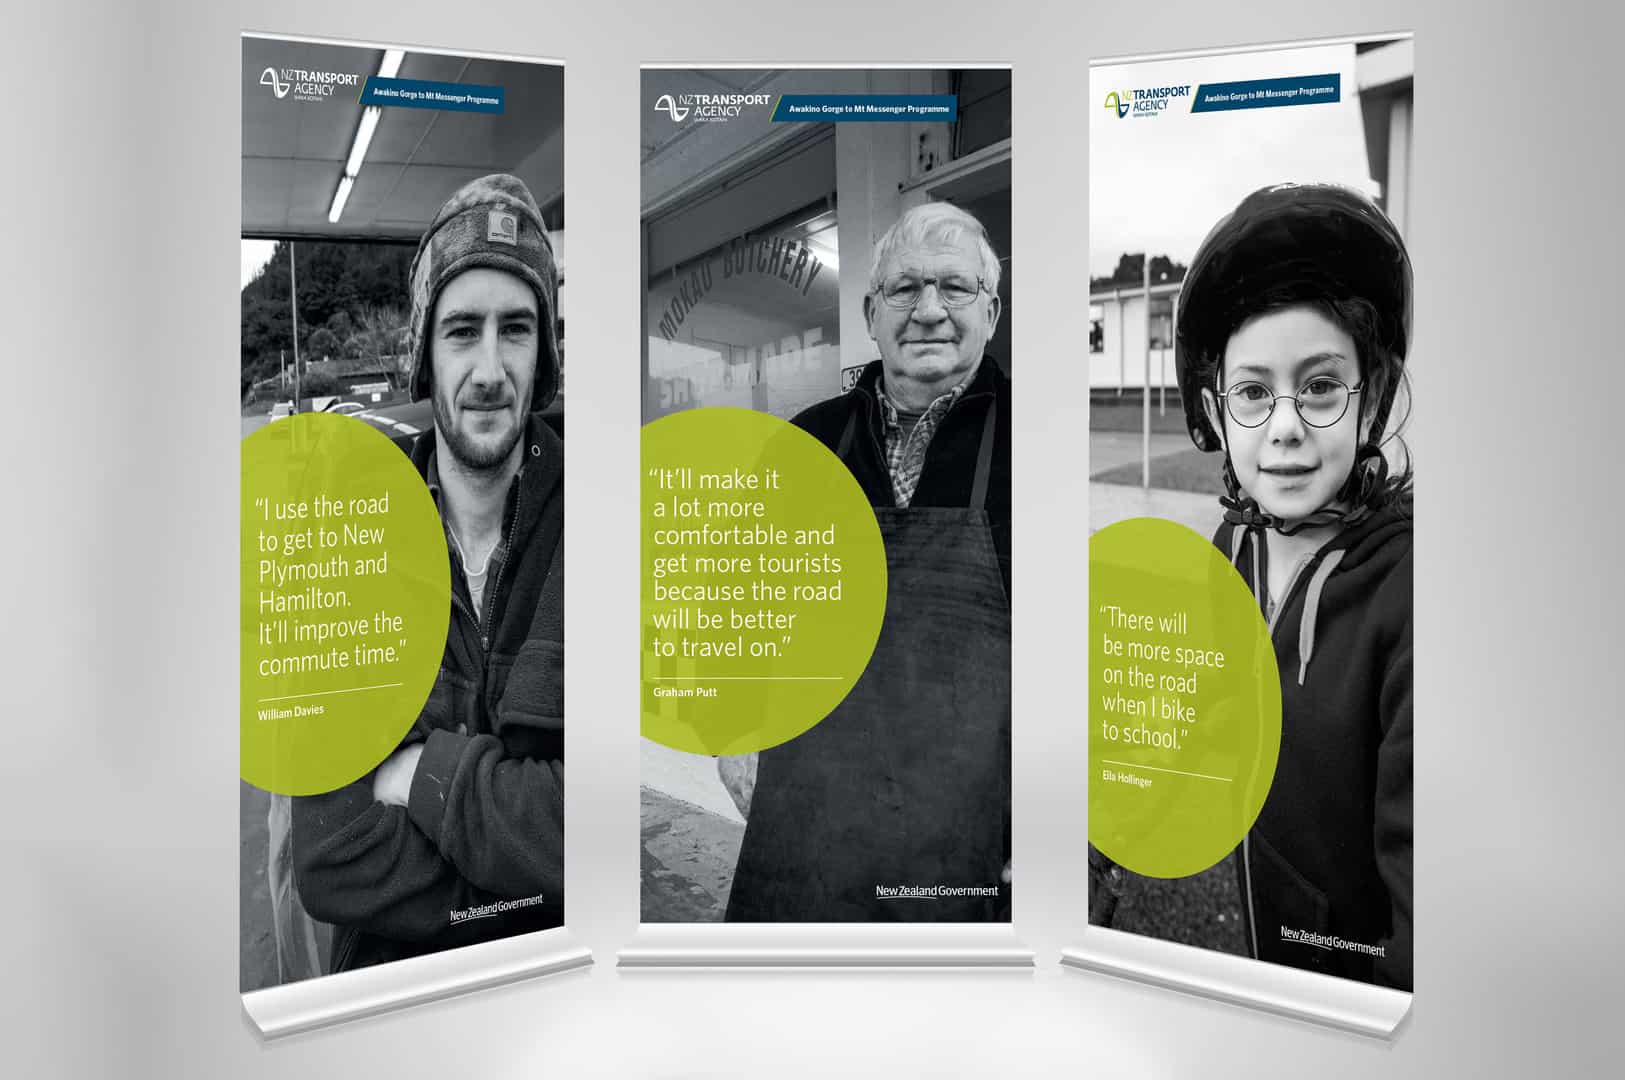
Consultation materials needed to facilitate a range of interactions with stakeholders. Oversized AO boards were created, outlining the various options – maps, visualisations, statements from members of the community. Including a range of support material in the form of banners, newspaper adverts, newsletters, and summary booklets.
Engage audiences
All this contributed to a very successful week of community consultations, with much higher participation numbers than anyone anticipated.
The Wonderlab Long Read on Good Graphic Design in Wellington
Why Good Graphic Design is Needed for the Public Consultation Process.
Effective public consultation is a critical part of any community or organizational engagement process. When it comes to presenting complex information in an accessible way, graphic design can be a powerful tool for improving the clarity of consultation outputs and boosting engagement. With good strategy, you can make your consultation material easy to follow and understand.
Keep things simple and straightforward. Graphics should be used strategically, providing additional support to topics that are explained in greater detail elsewhere. Aim for clean lines, basic shapes, and a consistent color palette that clearly differentiate ideas from each other. Use text sparingly – where possible, try to convey information through visuals alone.
Next, consider how best to present your data. Charts and diagrams are most effective when they’re clear and concise – don’t overload them with too much information at once. Different types of visualizations can also help to bring complex data to life – pie charts, for example, can be used to quickly and easily explain percentages, while timelines are great for illustrating sequences of events.
Finally, think about the formatting of your material. Break up large blocks of text with headings, images, or illustrations to help organize the flow of information. If appropriate, break out bullet-pointed lists to highlight the key concepts or action points within longer sections. Meanwhile, online platforms such as Survey Monkey or Zoom can be used to deliver interactive surveys or presentations that engage participants more deeply in the consultation process.
By putting these principles into practice, you’ll be better able to convey complex messages effectively. Good graphic design can help improve the success rate of consultations, giving communities better access to information and encouraging more meaningful participation. That’s why it pays to invest time and resources into creating high-quality visuals that clearly explain the purpose of your consultations so that everyone can benefit.